Financial highlights
| 71st term (consolidated) (ending March 31, 2022) |
72nd term (consolidated) (ending March 31, 2023) |
73rd term (consolidated) (ending March 31, 2024) |
74th term (consolidated) (ending March 31, 2025) |
|
|---|---|---|---|---|
| Sales (million yen) | 123,964 | 131,609 | 126,912 | 134,771 |
| Operating profit (million yen) |
5,502 | 6,287 | 5,809 | 6,824 |
| Ordinary profit (million yen) |
6,082 | 6,756 | 6,431 | 7,200 |
| Net income (million yen) |
4,245 | 4,967 | 4,674 | 4,892 |
| Net assets (million yen) |
83,307 | 86,319 | 88,193 | 86,231 |
| Total assets (million yen) |
120,560 | 122,806 | 127,694 | 121,332 |
| 71st term (consolidated) (ending March 31, 2022) |
72nd term (consolidated) (ending March 31, 2023) |
73rd term (consolidated) (ending March 31, 2024) |
74th term (consolidated) (ending March 31, 2025) |
|
|---|---|---|---|---|
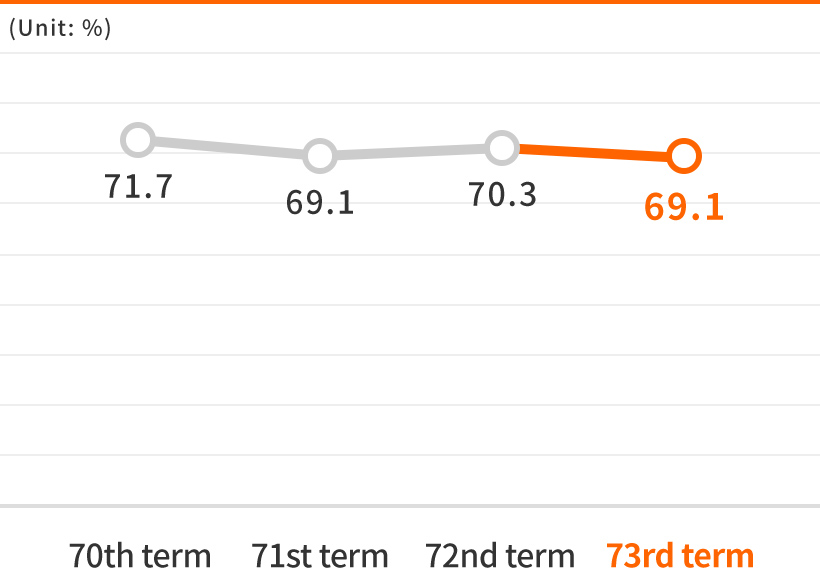
| Capital-to-asset ratio (%) |
69.1 | 70.3 | 69.1 | 71.1 |
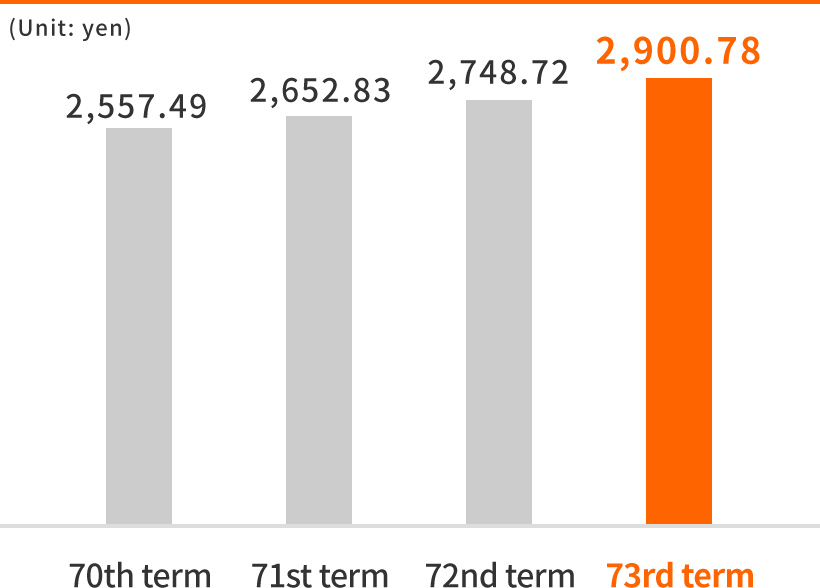
| Net asset value per share (yen) |
2,652.83 | 2,748.72 | 2,900.78 | 2,920.65 |
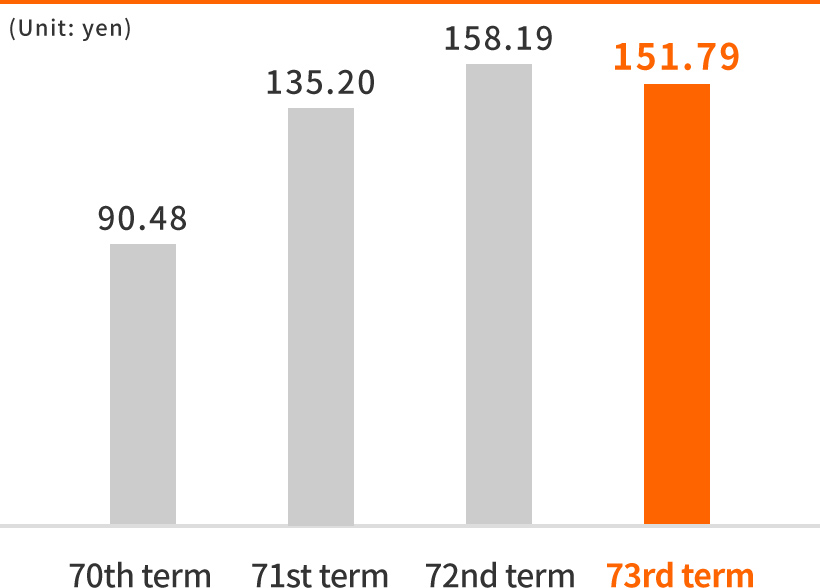
| Earnings per share (yen) |
135.20 | 158.19 | 151.79 | 164.32 |
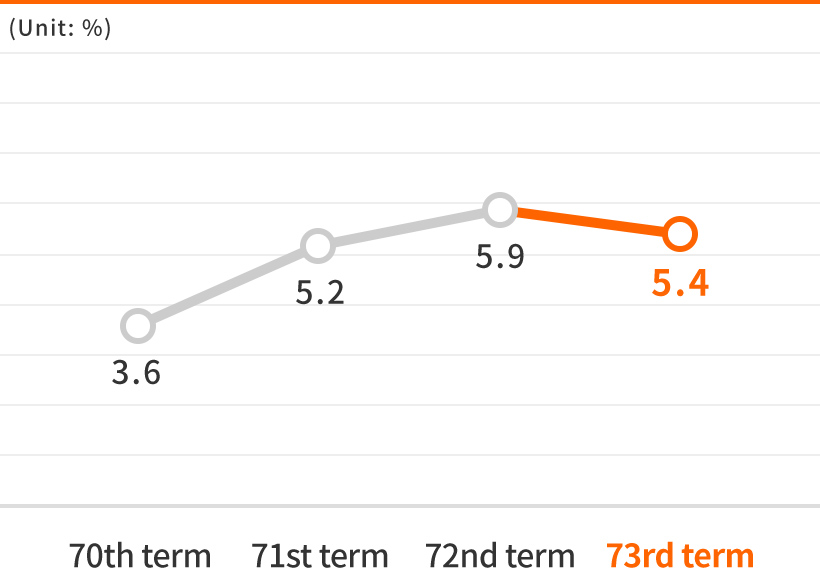
| Return on equity (%) |
5.2 | 5.9 | 5.4 | 5.6 |
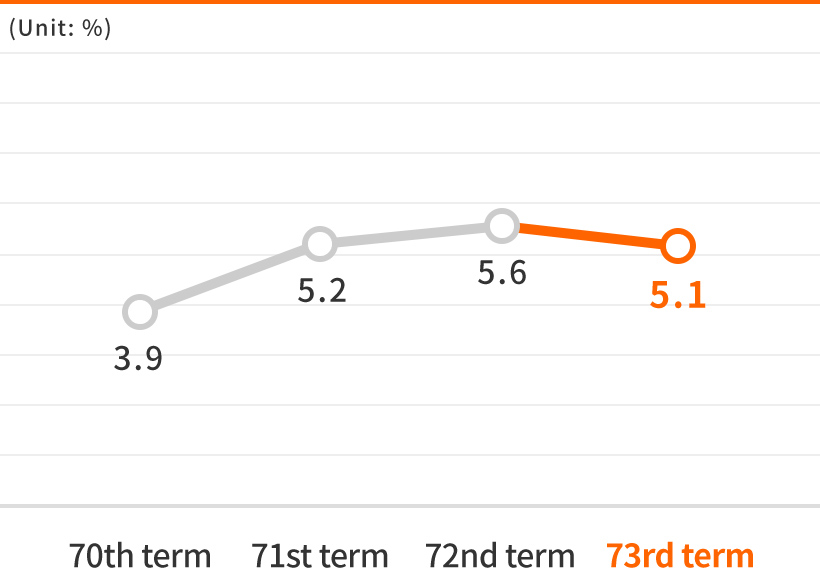
| Return on assets (%) |
5.2 | 5.6 | 5.1 | 5.8 |
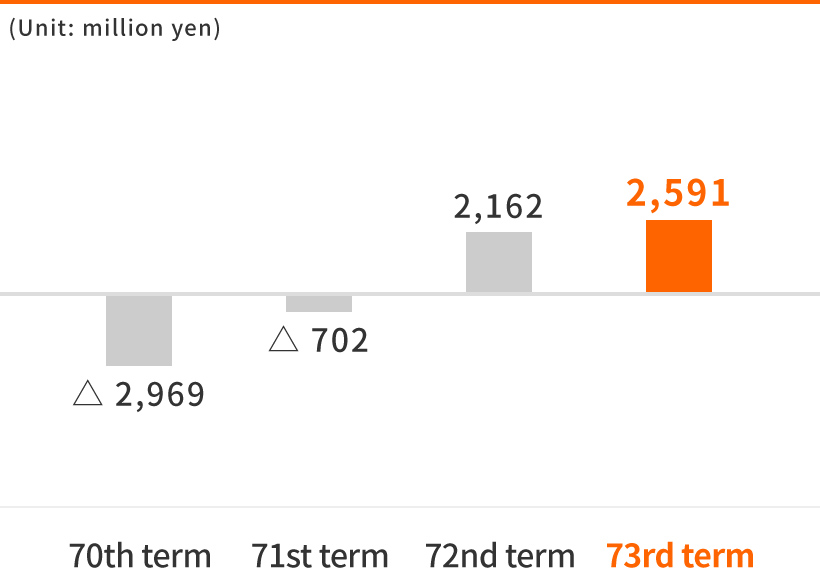
| Free cash flow (million yen) |
△702 | 2,162 | 2,591 | 7,743 |
Capital-to-asset ratio
Return on equity (ROE)
Return on assets (ROA)
Free cash flow
Earnings per share
Net asset value per share
This data has been prepared based on Nichiden's summary of financial results.
Although reasonable care has been taken in converting the data for display here, the possibility still exists that there are errors in this data as a result of factors outside the control of Nichiden, such as artificial manipulation by third parties or machine error. For more detailed information about account settlement and other financial matters, visit the IR Library.
